Mass Spectrometry
This guide is an early version — the text is complete, and a few figures are still being redrawn. Spotted something unclear? Let us know.
The question this page answers: How do we measure the mass of molecules?
Deeper reading: Clayden 2e: Chapter 3 Page 43–51 — see our chapter-by-chapter practice map for Clayden.
Weighing a molecule
What does MS measure?
Mass spectrometry (MS) essentially weighs a molecule. More specifically, it is measuring the ratio between the mass and charge of a molecule.
The instrument used for MS is a mass spectrometer, which works by
- volatilizing and ionizing the molecule into a beam of charged particles
- separating different particles by their mass / charge (m/z) ratios
- counting the number of particles at each m/z ratio to yield a y axis of either “count” or “relative abundance/intensity”.
Ionization and fragmentation
EI vs ESI; why fragments appear
To be detected by MS, the particle cannot have z = 0. As most molecules are not inherently formally charged, we rely two main techniques: electron impact (EI) and electrospray ionization (ESI) to ionize the molecule. Here’s an example for EI, in which an electron beam is used to “knock off” an electron from a molecule:

Note that because of the high energy involved, we often see fragmentation of ions ito smaller pieces. Here is an actual example of this process for cyclohexane:

And here is the actual data from gas chromatography MS for cyclohexanone where you can see the molecular ion at 98 m/z and the fragment at 55 m/z. There are other fragmentations that account for the other m/z peaks you see:
Recognizing isotope patterns
What causes M+1 and M+2 peaks?
Recognizing isotope patterns is crucial for interpreting MS data. The presence of isotopes is typically detected at m/z values of M+1, and M+2.
Because MS is measuring the mass of individual molecules, the natural abundance of isotopes becomes a factor. For example, 99% of methane molecules will be 12CH4, but 1% of them will have 13CH4. Therefore, when we look at the MS of methane, we see a peak at 16 m/z in addition to a very tiny peak at 17 m/z.:
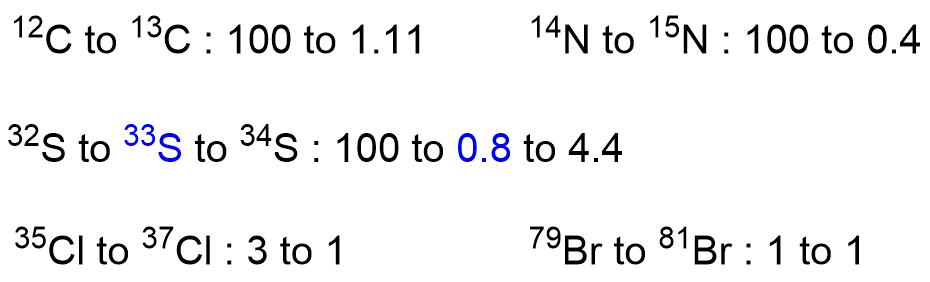
The isotope ratios that will affect MS data interpretation the most are for C, N, S, Cl, and Br:
These numbers result in patterns between and M, M+1, M+2, here are examples:
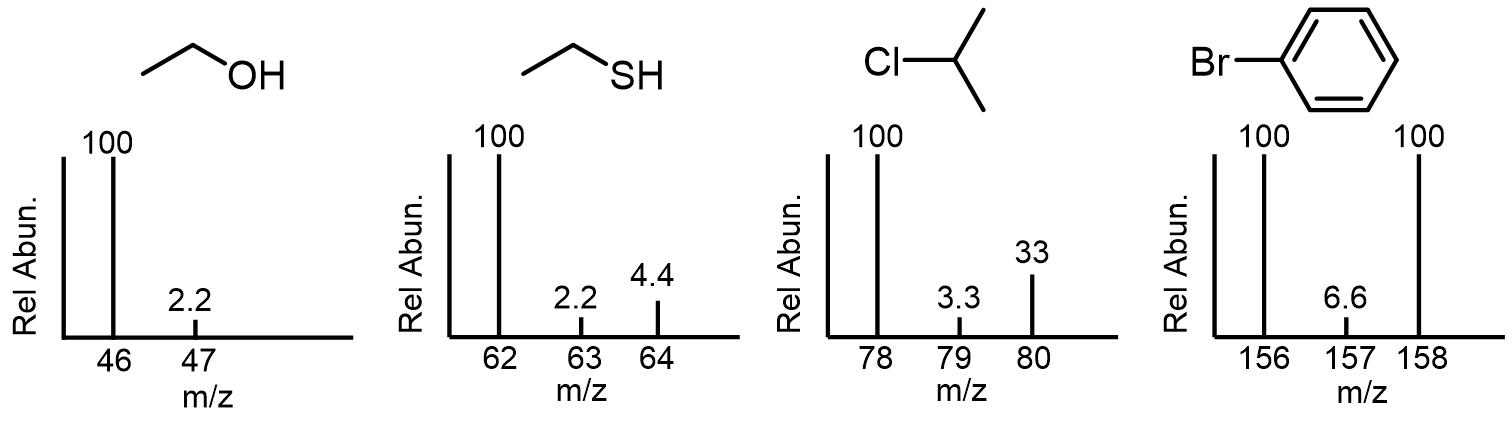
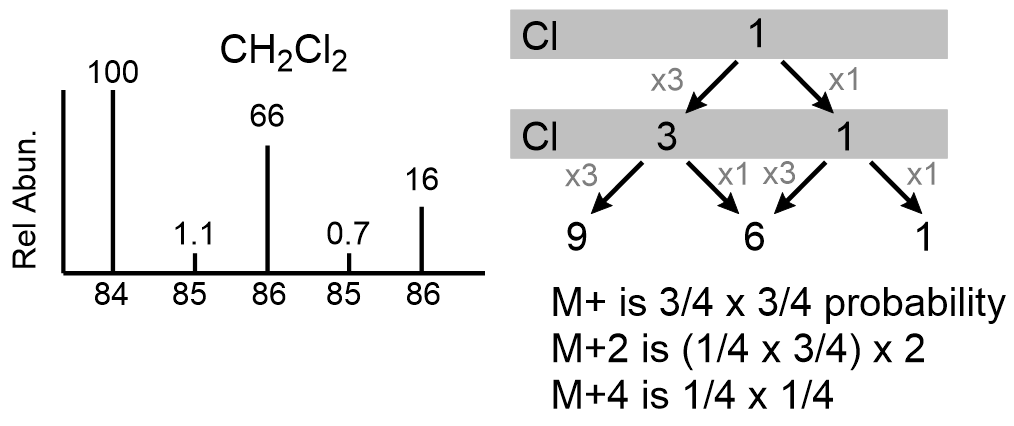
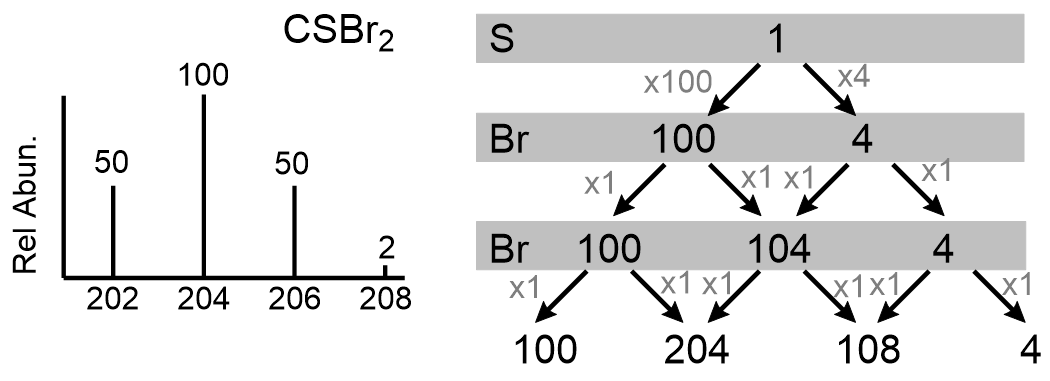
If there are multiple atoms in a molecule that contribute M+1 and M+2 values, more complicated patterns emerge and peaks are seen at M+4, M+6, etc.
Here are two examples:
Establishing the molecular formula
How do you find the molecular formula?
The purpose of interpreting MS data is to establish the molecular formula of an unknown sample using the following guidelines:
- look for isotope patterns for # of C atoms
- using the Nitrogen “Rule”
- look for isotope patterns indicating presence of S, Cl, Br (or some combination)
- working backwards to determine possible molecular formulas for M.
Here is a worked through example:
Spotted an error, or want a topic covered next? Let us know.