Proton NMR Spectroscopy
This guide is an early version — the text is complete, and a few figures are still being redrawn. Spotted something unclear? Let us know.
The question this page answers: How can we gain more information about the arrangement of H atoms in a molecule?
Deeper reading: Clayden 2e: Chapter 8 Page 163–181 — see our chapter-by-chapter practice map for Clayden.
Proton NMR operates just like 13C NMR
Same idea, smaller shift range
1H NMR spectroscopy operates just like 13C NMR, except that H nuclei are being spin flipped. Often, people say “proton NMR” instead of “one H NMR”.
Because there are less electrons around H, the relative differences in chemical shift for H nuclei are smaller than they are for C nuclei. Here are general ranges of common 1H chemical shifts:
Resonance and inductive effects
What shifts a proton?
Just like in 13C NMR, resonance and inductive effects influence the frequency at which 1H nuclei undergo spin-flipping.
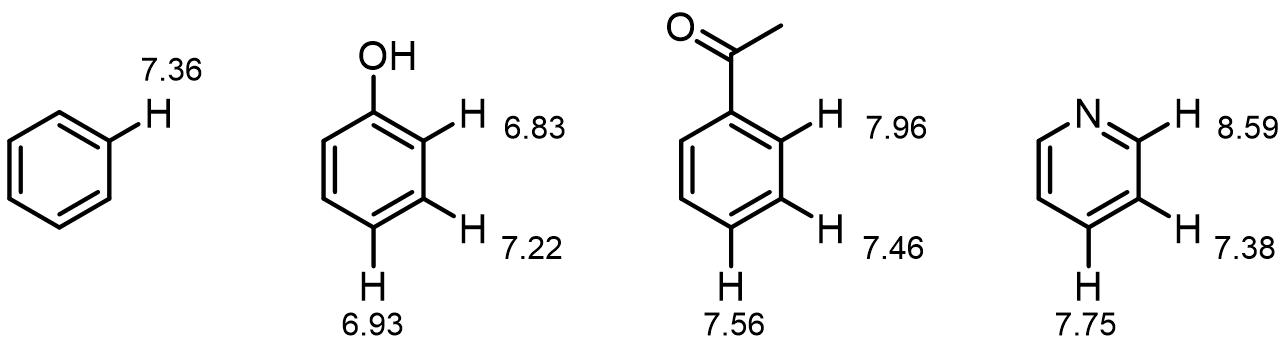
Resonance effects can have observable effects on 1H chemical shifts. Here are examples:
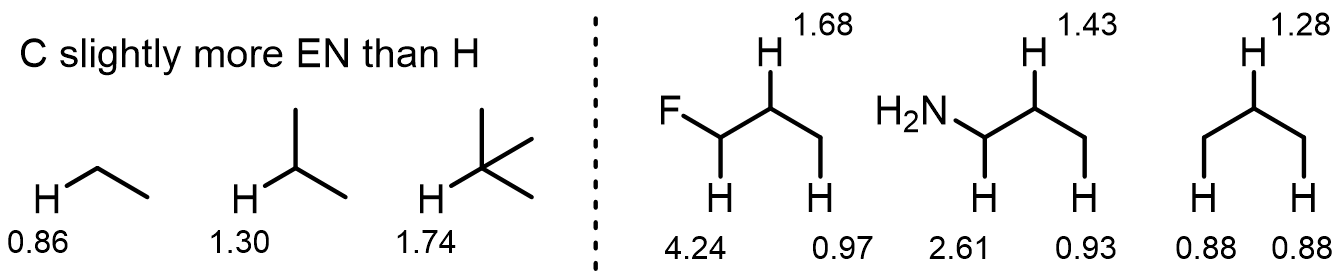
Inductive effects are also still significant:
Magnetic anisotropy of nearby pi-systems
How do pi systems shift protons?
In addition, magnetic anisotropy of nearby pi-systems can significantly shield/deshield 1H nuclei.
Magnetic anisotropy occurs because interactions between nearby electrons and the external applied field can induce an additional local magnetic field. Depending on the position of protons within this induced field, they are either shielded or deshielded, as shown below:
Note that here the “+δ” indicates regions where protons would be shifted downfield and the “–δ“ indicates regions where protons would be shifted upfield.
Here are some examples of the impact of magnetic anisotropy:

Exchangeable and hydrogen-bonding protons
Why are OH and NH peaks broad?
Exchangeable and hydrogen-bonding protons have unpredictable shifts and broadened peaks.
OH and NH protons can appear as broad peaks at a chemical shift that varies, depending on the exact experimental conditions used for collecting the data. Here is an example:
Integration and the relative ratio of H’s
What does peak area tell you?
1H NMR can be integrated to determine the relative ratio of H’s present.
The area under the curve (the integral) can be determined using a computer. If a peak has an integration twice as large as another peak, then there are twice as many H atoms contributing to that signal. Here is an example:
Here, the integration reflects that the molecule has H atoms in four different chemical environments, in a ratio of 2:3:2:3. The red “S” heights provide pthis relative ratio.
Magnetic coupling and splitting patterns
Why do peaks split?
Magnetic coupling between nearby nuclei leads to peaks that show complex splitting patterns. Although described here as always being between two H atoms, coupling can take place between ANY two nuclei.
In other words, given an atom HA, the spins of neighboring nuclei (such as HX) are also little magnetic fields that can affect the shift of HA. Because neighboring nuclei can be either aligned with or against the external magnetic field (B0), multiple combinations of up- and downfield shifting effects are possible, leading to the appearance of peaks being split into multiple smaller peaks. Here is an example:

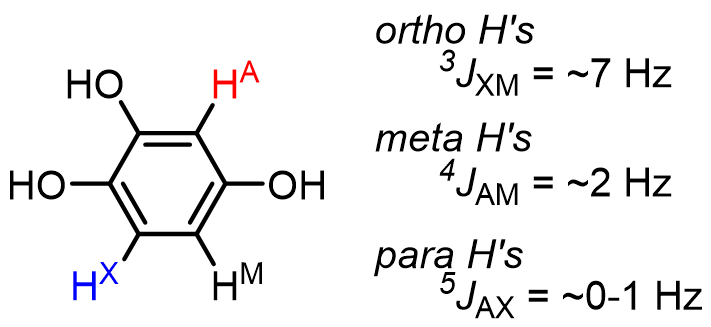
The magnitude of up or downfield shifting that occurs is related to the strength of interaction between the two nuclei of interest (HA and HX here). This interaction strength is called the J value or coupling constant and is measured in Hz. The number of bonds (n) between the coupling nuclei is indicated with the notation nJ. Typically, n = 2 or 3, but nonzero J values for n = 4, and even 5 can be observed in some cases:
There are two rules of thumb for predicting splitting patterns:
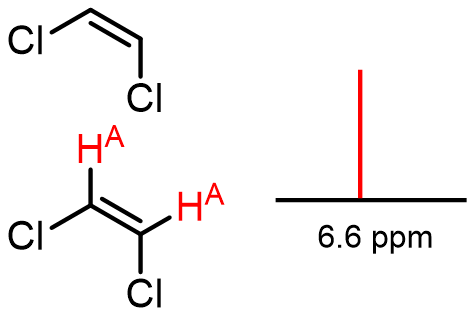
- Atoms of identical symmetry do not couple with each other
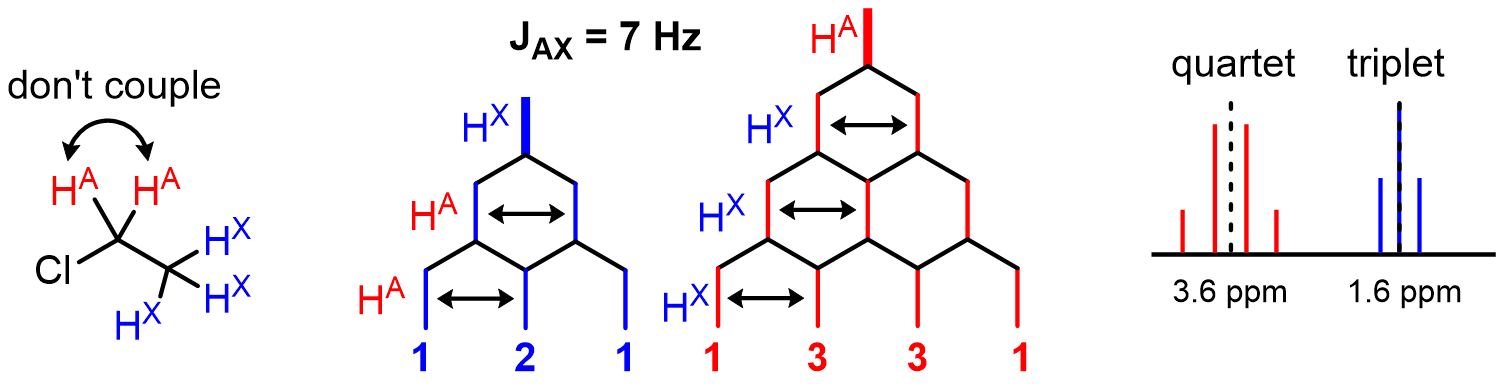
- For an HA coupling with n HX neighbors with the same J value, the signal is split into n+1 lines with Pascal's triangle ratios.
Here is an example illustrating that atoms of identical symmetry do not couple:
Here is a slightly more complicated example that shows how patterns emerge:
Things get more interesting if there are multiple neighboring nuclei that each couple with a different J value.
Here is an example:
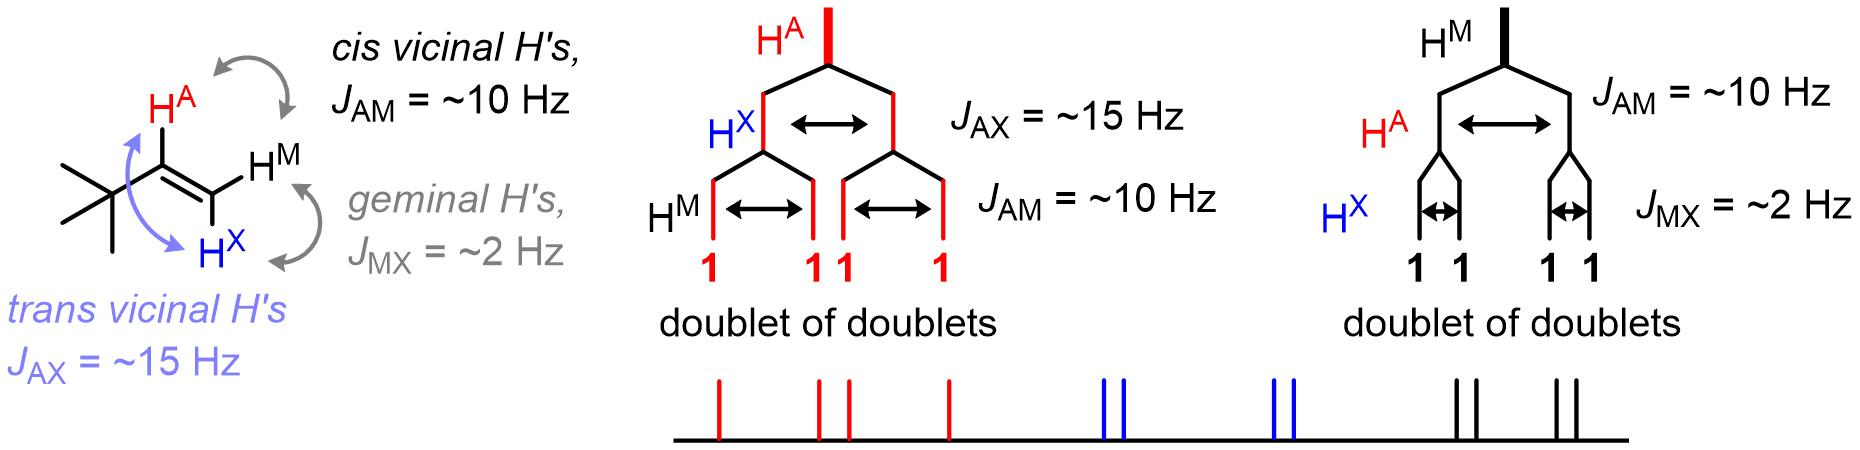
Note that when referring to ___let of ___lets, always start with the largest J value and work towards the smallest one.
J values are also dependent on the geometrical arrangement of the nuclei with respect to each other.
This dependence matters the most in alkanes and cycloalkanes, and can be used to extract information about the dihedral angle between two C–H bonds using the Karplus equation.
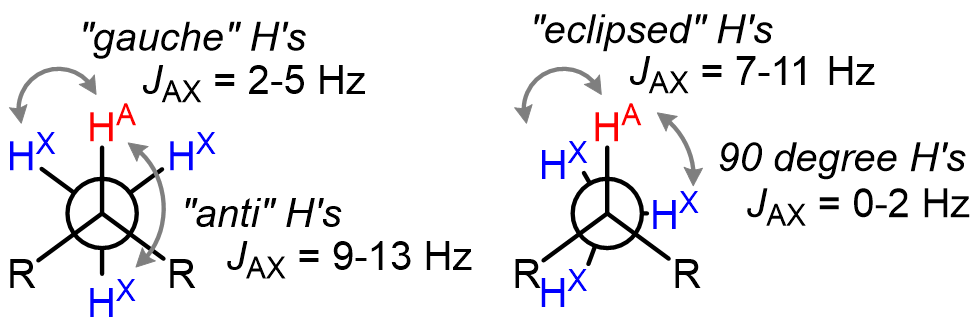
Note that in alkanes with free rotation around the C–C bond, the average J value of 7 Hz is what is observed experimentally.
Spotted an error, or want a topic covered next? Let us know.